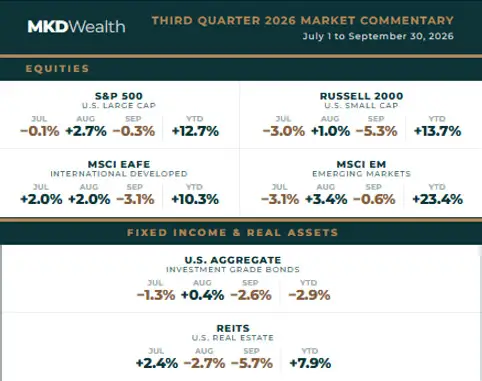


Monthly columns show total returns for July 1 to July 31, August 1 to August 31, and September 1 to September 30, 2026. YTD reflects the nine month period from January 1 through September 30, 2026.
Executive Summary
The third quarter of 2026, covering July 1 through September 30, was shaped by rising interest rates and a Federal Reserve that shifted from holding steady to raising rates. Market leadership broadened in July, equities advanced in August despite a more hawkish message from Fed Chair Kevin Warsh at Jackson Hole, and September brought broad weakness after the Fed raised its policy rate by 25 basis points. Through September 30, the S&P 500 is up 12.7% year to date, the Russell 2000 is up 13.7%, the MSCI EAFE Index is up 10.3%, and the MSCI EM Index is up 23.4%. Bonds struggled as yields rose, with the Bloomberg U.S. Aggregate Bond Index down 2.9% year to date, while commodities gained in all three months of the quarter and are up 32.9% year to date. This report walks through the month by month market backdrop, the underlying economic data for the quarter, and what it means for portfolio positioning heading into the final quarter of the year.
Market Review
July 2026 was a volatile month as investors weighed strong corporate earnings against renewed concerns about AI-related valuations and heavy capital spending. The Federal Reserve held its policy rate at 3.50% to 3.75% at its July 29 meeting, but three dissents in favor of a hike pushed Treasury yields higher. The S&P 500 declined 0.1% for the month, and the Russell 2000 fell 3.0% for the month as rising yields created a headwind for smaller companies. Leadership rotated away from the largest growth stocks toward energy, financials, and more value oriented areas. The MSCI EAFE Index gained 2.0% for the month, helped by strength in Europe and the United Kingdom and a weaker U.S. dollar, while the MSCI EM Index declined 3.1% for the month as semiconductor shares in technology heavy Asian markets pulled back. The Bloomberg U.S. Aggregate Bond Index fell 1.3% for the month. REITs gained 2.4% for the month, supported by data center, industrial, and specialized property sectors, and the Bloomberg Commodity Index rose 7.5% for the month, the best result among major asset classes, as tensions involving Iran contributed to higher energy prices.
August 2026 was constructive but uneven. At the Jackson Hole symposium on August 28, Chair Warsh signaled that rates could move higher, and the odds of a September hike jumped from roughly one in three to better than half. The 10-year Treasury yield climbed above 4.7%, and the 30-year yield touched its highest level since 2007 after the 60-day U.S. and Iran negotiating window lapsed on August 17 with the Strait of Hormuz still constrained. Equities advanced regardless. The S&P 500 gained 2.7% for the month as investors leaned into energy and materials, while the Russell 2000 rose 1.0% for the month and held a 20.0% year to date gain through August 31. The MSCI EAFE Index returned 2.0% for the month, and the MSCI EM Index gained 3.4% for the month on strength in South Korea and Taiwan. The Bloomberg U.S. Aggregate Bond Index returned 0.4% for the month as attractive starting yields cushioned the move in rates. REITs fell 2.7% for the month as long-term rates rose, while the Bloomberg Commodity Index climbed 7.4% for the month as Brent crude moved above $90 per barrel.
September 2026 brought broad weakness across financial markets. The Federal Reserve raised its policy rate by 25 basis points and signaled that additional hikes may be necessary, and the 10-year Treasury yield rose more than 50 basis points to finish the month just below 5.30%, a level not seen since 2007. The S&P 500 declined 0.3% for the month and remained up 12.7% year to date through September 30. The Russell 2000 fell 5.3% for the month as smaller, more leveraged companies felt the impact of higher rates, though it still finished ahead of large caps with a 13.7% year to date gain. The MSCI EAFE Index declined 3.1% for the month, while the MSCI EM Index declined a more modest 0.6% for the month and remains the strongest equity performer for the year. The Bloomberg U.S. Aggregate Bond Index fell 2.6% for the month, and REITs fell 5.7% for the month as tighter financial conditions weighed on listed real estate. Commodities were the only major asset class to advance, with the Bloomberg Commodity Index gaining 0.6% for the month.
NOTABLE DEVELOPMENT: THE “TREASURY TWIST” · AUGUST 2026
On August 19, shortly after the 30-year Treasury yield reached its highest level since 2007, the U.S. Treasury announced it would at least double the maximum size of its long-dated buyback operations, from $2 billion to $4 billion, between September 9 and November 4. Secretary Bessent described the move as a “Treasury Twist.” The 30-year yield fell roughly 10 basis points before reversing the next day, and U.S. debt outstanding crossed $40 trillion the same day, raising the question of whether the Fed or the Treasury will have more influence over long-term rates.
Market Data: Economic Indicators
The figures below supplement the return data on page one and reflect the same July through September 2026 period unless otherwise noted.
Federal Funds Target Range
Held at 3.50% to 3.75% at the July 29, 2026 FOMC meeting, with three dissents in favor of a hike; raised by 25 basis points in September 2026
10-Year Treasury Yield)
Above 4.7% in August 2026; rose more than 50 basis points in September to finish just below 5.30%, a level not seen since 2007
Inflation vs. Fed Target
Above target for 65 consecutive months, as cited by Chair Warsh at Jackson Hole on August 28, 2026; 2% PCE reaffirmed as a “firm, fixed target”
Bloomberg U.S. Aggregate Yield
5.1% as of the August 2026 report, versus expected inflation of 2.3%
S&P 500 Earnings Growth
Expected third consecutive quarter of year over year growth above 25%, as of the September 2026 report
AI Investment and U.S. GDP
Cumulative AI-related investment above 2% of U.S. GDP over the past three years; AI-related technology investment added 0.5 percentage points to 2025 U.S. GDP growtht
What This Means for Portfolios
Higher rates are now the dominant force. Over the quarter the Fed moved from a hold with three dissents in July, to a hawkish message at Jackson Hole in August, to a 25 basis point hike in September, and market pricing suggests at least one more hike at its two remaining meetings this year. Inflation has been above target for 65 consecutive months, and higher energy prices tied to geopolitical instability are adding pressure that tighter financial conditions cannot directly resolve. Rate sensitive areas felt this most, with REITs and small caps each falling more than 5% in September.
Bonds are offering meaningful income. With the Bloomberg U.S. Aggregate Bond Index yielding 5.1% in August against expected inflation of 2.3%, bonds are offering yields above inflation for the first time in many years, and that coupon should help compensate for rate volatility going forward. Duration risk has become more two-sided, with short-term yields anchored by the Fed and long-term yields driven by federal borrowing needs, geopolitics, and Treasury policy. Today’s yields allow investors to earn meaningful income without taking on the full uncertainty of longer-dated bonds.
AI spending still drives earnings, but financing is now in focus. The S&P 500 is expected to post a third consecutive quarter of year over year earnings growth above 25%, which has supported double digit equity returns in 2026 without a matching rise in valuation multiples. At the same time, free cash flow expectations for the major hyperscalers have turned negative due to AI-related spending, pushing more of these companies toward debt financing. With the Fed now raising rates, investors are paying closer attention to leverage and to whether this spending will earn attractive returns.
Taken together, the quarter reinforced the value of diversification across asset classes. Through September 30, small cap and emerging market equities remain ahead of the S&P 500 year to date, international developed equities trail it, and commodities have been the strongest performing major asset class this year, up 32.9%. November’s midterm elections add another source of uncertainty, though markets have historically tended to perform well once midterms conclude. The economy continues to expand, employment conditions remain healthy, and corporate earnings growth continues to exceed expectations in many sectors. We continue to favor a disciplined, broadly diversified approach as we enter the fourth quarter.
As always, we are here and available to discuss.
Disclosures
Comparisons to indices referenced herein are for illustrative purposes only. Indices cannot be invested in directly. Unmanaged index returns assume reinvestment of any and all distributions and do not reflect fees or expenses.
All monthly and year-to-date returns shown are as reported in the July, August, and September 2026 market commentaries from Fiducient Advisors, LLC, a Wealthspire Company. MKD Wealth has not independently verified all information obtained from this source. YTD figures reflect the nine-month period from January 1 through September 30, 2026, as reported directly in the September 2026 commentary. Economic and fundamental data (Federal Reserve policy rate, Treasury yields, inflation, bond yields, earnings growth, and AI-related investment) are as reported in the referenced commentaries, which cite FactSet, CME FedWatch, the U.S. Treasury, the Federal Reserve Bank of Kansas City Jackson Hole symposium, Oxford Economics, and the International Monetary Fund as original sources.
The opinions and market observations presented are as of September 30, 2026, and are subject to change without notice. Any forecasts, expectations or forward-looking statements are based on current assumptions and are not guarantees of future results. This material is provided for general informational purposes and is not individualized investment advice or a recommendation to buy or sell any security or adopt any investment strategy. Appropriate portfolio allocations will vary based on each investor’s objectives, risk tolerance, time horizon, and financial circumstances. All investing involves risk, including the possible loss of principal.
S&P 500: 500 large U.S. companies. Russell 2000: 2,000 smallest companies in the Russell 3000. MSCI EAFE: developed markets ex-U.S./Canada. MSCI EM: emerging market equities. Bloomberg U.S. Aggregate: U.S. investment-grade bonds. Bloomberg Commodity Index: commodity futures. FTSE NAREIT Equity REITs: non-timber/infrastructure equity REITs.
Monthly columns show total returns for July 1 to July 31, August 1 to August 31, and September 1 to September 30, 2026. YTD reflects the nine month period from January 1 through September 30, 2026.
Executive Summary
The third quarter of 2026, covering July 1 through September 30, was shaped by rising interest rates and a Federal Reserve that shifted from holding steady to raising rates. Market leadership broadened in July, equities advanced in August despite a more hawkish message from Fed Chair Kevin Warsh at Jackson Hole, and September brought broad weakness after the Fed raised its policy rate by 25 basis points. Through September 30, the S&P 500 is up 12.7% year to date, the Russell 2000 is up 13.7%, the MSCI EAFE Index is up 10.3%, and the MSCI EM Index is up 23.4%. Bonds struggled as yields rose, with the Bloomberg U.S. Aggregate Bond Index down 2.9% year to date, while commodities gained in all three months of the quarter and are up 32.9% year to date. This report walks through the month by month market backdrop, the underlying economic data for the quarter, and what it means for portfolio positioning heading into the final quarter of the year.
Market Review
July 2026 was a volatile month as investors weighed strong corporate earnings against renewed concerns about AI-related valuations and heavy capital spending. The Federal Reserve held its policy rate at 3.50% to 3.75% at its July 29 meeting, but three dissents in favor of a hike pushed Treasury yields higher. The S&P 500 declined 0.1% for the month, and the Russell 2000 fell 3.0% for the month as rising yields created a headwind for smaller companies. Leadership rotated away from the largest growth stocks toward energy, financials, and more value oriented areas. The MSCI EAFE Index gained 2.0% for the month, helped by strength in Europe and the United Kingdom and a weaker U.S. dollar, while the MSCI EM Index declined 3.1% for the month as semiconductor shares in technology heavy Asian markets pulled back. The Bloomberg U.S. Aggregate Bond Index fell 1.3% for the month. REITs gained 2.4% for the month, supported by data center, industrial, and specialized property sectors, and the Bloomberg Commodity Index rose 7.5% for the month, the best result among major asset classes, as tensions involving Iran contributed to higher energy prices.
August 2026 was constructive but uneven. At the Jackson Hole symposium on August 28, Chair Warsh signaled that rates could move higher, and the odds of a September hike jumped from roughly one in three to better than half. The 10-year Treasury yield climbed above 4.7%, and the 30-year yield touched its highest level since 2007 after the 60-day U.S. and Iran negotiating window lapsed on August 17 with the Strait of Hormuz still constrained. Equities advanced regardless. The S&P 500 gained 2.7% for the month as investors leaned into energy and materials, while the Russell 2000 rose 1.0% for the month and held a 20.0% year to date gain through August 31. The MSCI EAFE Index returned 2.0% for the month, and the MSCI EM Index gained 3.4% for the month on strength in South Korea and Taiwan. The Bloomberg U.S. Aggregate Bond Index returned 0.4% for the month as attractive starting yields cushioned the move in rates. REITs fell 2.7% for the month as long-term rates rose, while the Bloomberg Commodity Index climbed 7.4% for the month as Brent crude moved above $90 per barrel.
September 2026 brought broad weakness across financial markets. The Federal Reserve raised its policy rate by 25 basis points and signaled that additional hikes may be necessary, and the 10-year Treasury yield rose more than 50 basis points to finish the month just below 5.30%, a level not seen since 2007. The S&P 500 declined 0.3% for the month and remained up 12.7% year to date through September 30. The Russell 2000 fell 5.3% for the month as smaller, more leveraged companies felt the impact of higher rates, though it still finished ahead of large caps with a 13.7% year to date gain. The MSCI EAFE Index declined 3.1% for the month, while the MSCI EM Index declined a more modest 0.6% for the month and remains the strongest equity performer for the year. The Bloomberg U.S. Aggregate Bond Index fell 2.6% for the month, and REITs fell 5.7% for the month as tighter financial conditions weighed on listed real estate. Commodities were the only major asset class to advance, with the Bloomberg Commodity Index gaining 0.6% for the month.
NOTABLE DEVELOPMENT: THE “TREASURY TWIST” · AUGUST 2026
On August 19, shortly after the 30-year Treasury yield reached its highest level since 2007, the U.S. Treasury announced it would at least double the maximum size of its long-dated buyback operations, from $2 billion to $4 billion, between September 9 and November 4. Secretary Bessent described the move as a “Treasury Twist.” The 30-year yield fell roughly 10 basis points before reversing the next day, and U.S. debt outstanding crossed $40 trillion the same day, raising the question of whether the Fed or the Treasury will have more influence over long-term rates.
Market Data: Economic Indicators
The figures below supplement the return data on page one and reflect the same July through September 2026 period unless otherwise noted.
Federal Funds Target Range
Held at 3.50% to 3.75% at the July 29, 2026 FOMC meeting, with three dissents in favor of a hike; raised by 25 basis points in September 2026
10-Year Treasury Yield)
Above 4.7% in August 2026; rose more than 50 basis points in September to finish just below 5.30%, a level not seen since 2007
Inflation vs. Fed Target
Above target for 65 consecutive months, as cited by Chair Warsh at Jackson Hole on August 28, 2026; 2% PCE reaffirmed as a “firm, fixed target”
Bloomberg U.S. Aggregate Yield
5.1% as of the August 2026 report, versus expected inflation of 2.3%
S&P 500 Earnings Growth
Expected third consecutive quarter of year over year growth above 25%, as of the September 2026 report
AI Investment and U.S. GDP
Cumulative AI-related investment above 2% of U.S. GDP over the past three years; AI-related technology investment added 0.5 percentage points to 2025 U.S. GDP growtht
What This Means for Portfolios
Higher rates are now the dominant force. Over the quarter the Fed moved from a hold with three dissents in July, to a hawkish message at Jackson Hole in August, to a 25 basis point hike in September, and market pricing suggests at least one more hike at its two remaining meetings this year. Inflation has been above target for 65 consecutive months, and higher energy prices tied to geopolitical instability are adding pressure that tighter financial conditions cannot directly resolve. Rate sensitive areas felt this most, with REITs and small caps each falling more than 5% in September.
Bonds are offering meaningful income. With the Bloomberg U.S. Aggregate Bond Index yielding 5.1% in August against expected inflation of 2.3%, bonds are offering yields above inflation for the first time in many years, and that coupon should help compensate for rate volatility going forward. Duration risk has become more two-sided, with short-term yields anchored by the Fed and long-term yields driven by federal borrowing needs, geopolitics, and Treasury policy. Today’s yields allow investors to earn meaningful income without taking on the full uncertainty of longer-dated bonds.
AI spending still drives earnings, but financing is now in focus. The S&P 500 is expected to post a third consecutive quarter of year over year earnings growth above 25%, which has supported double digit equity returns in 2026 without a matching rise in valuation multiples. At the same time, free cash flow expectations for the major hyperscalers have turned negative due to AI-related spending, pushing more of these companies toward debt financing. With the Fed now raising rates, investors are paying closer attention to leverage and to whether this spending will earn attractive returns.
Taken together, the quarter reinforced the value of diversification across asset classes. Through September 30, small cap and emerging market equities remain ahead of the S&P 500 year to date, international developed equities trail it, and commodities have been the strongest performing major asset class this year, up 32.9%. November’s midterm elections add another source of uncertainty, though markets have historically tended to perform well once midterms conclude. The economy continues to expand, employment conditions remain healthy, and corporate earnings growth continues to exceed expectations in many sectors. We continue to favor a disciplined, broadly diversified approach as we enter the fourth quarter.
As always, we are here and available to discuss.
Disclosures
Comparisons to indices referenced herein are for illustrative purposes only. Indices cannot be invested in directly. Unmanaged index returns assume reinvestment of any and all distributions and do not reflect fees or expenses.
All monthly and year-to-date returns shown are as reported in the July, August, and September 2026 market commentaries from Fiducient Advisors, LLC, a Wealthspire Company. MKD Wealth has not independently verified all information obtained from this source. YTD figures reflect the nine-month period from January 1 through September 30, 2026, as reported directly in the September 2026 commentary. Economic and fundamental data (Federal Reserve policy rate, Treasury yields, inflation, bond yields, earnings growth, and AI-related investment) are as reported in the referenced commentaries, which cite FactSet, CME FedWatch, the U.S. Treasury, the Federal Reserve Bank of Kansas City Jackson Hole symposium, Oxford Economics, and the International Monetary Fund as original sources.
The opinions and market observations presented are as of September 30, 2026, and are subject to change without notice. Any forecasts, expectations or forward-looking statements are based on current assumptions and are not guarantees of future results. This material is provided for general informational purposes and is not individualized investment advice or a recommendation to buy or sell any security or adopt any investment strategy. Appropriate portfolio allocations will vary based on each investor’s objectives, risk tolerance, time horizon, and financial circumstances. All investing involves risk, including the possible loss of principal.
S&P 500: 500 large U.S. companies. Russell 2000: 2,000 smallest companies in the Russell 3000. MSCI EAFE: developed markets ex-U.S./Canada. MSCI EM: emerging market equities. Bloomberg U.S. Aggregate: U.S. investment-grade bonds. Bloomberg Commodity Index: commodity futures. FTSE NAREIT Equity REITs: non-timber/infrastructure equity REITs.
Monthly columns show total returns for July 1 to July 31, August 1 to August 31, and September 1 to September 30, 2026. YTD reflects the nine month period from January 1 through September 30, 2026.
Executive Summary
The third quarter of 2026, covering July 1 through September 30, was shaped by rising interest rates and a Federal Reserve that shifted from holding steady to raising rates. Market leadership broadened in July, equities advanced in August despite a more hawkish message from Fed Chair Kevin Warsh at Jackson Hole, and September brought broad weakness after the Fed raised its policy rate by 25 basis points. Through September 30, the S&P 500 is up 12.7% year to date, the Russell 2000 is up 13.7%, the MSCI EAFE Index is up 10.3%, and the MSCI EM Index is up 23.4%. Bonds struggled as yields rose, with the Bloomberg U.S. Aggregate Bond Index down 2.9% year to date, while commodities gained in all three months of the quarter and are up 32.9% year to date. This report walks through the month by month market backdrop, the underlying economic data for the quarter, and what it means for portfolio positioning heading into the final quarter of the year.
Market Review
July 2026 was a volatile month as investors weighed strong corporate earnings against renewed concerns about AI-related valuations and heavy capital spending. The Federal Reserve held its policy rate at 3.50% to 3.75% at its July 29 meeting, but three dissents in favor of a hike pushed Treasury yields higher. The S&P 500 declined 0.1% for the month, and the Russell 2000 fell 3.0% for the month as rising yields created a headwind for smaller companies. Leadership rotated away from the largest growth stocks toward energy, financials, and more value oriented areas. The MSCI EAFE Index gained 2.0% for the month, helped by strength in Europe and the United Kingdom and a weaker U.S. dollar, while the MSCI EM Index declined 3.1% for the month as semiconductor shares in technology heavy Asian markets pulled back. The Bloomberg U.S. Aggregate Bond Index fell 1.3% for the month. REITs gained 2.4% for the month, supported by data center, industrial, and specialized property sectors, and the Bloomberg Commodity Index rose 7.5% for the month, the best result among major asset classes, as tensions involving Iran contributed to higher energy prices.
August 2026 was constructive but uneven. At the Jackson Hole symposium on August 28, Chair Warsh signaled that rates could move higher, and the odds of a September hike jumped from roughly one in three to better than half. The 10-year Treasury yield climbed above 4.7%, and the 30-year yield touched its highest level since 2007 after the 60-day U.S. and Iran negotiating window lapsed on August 17 with the Strait of Hormuz still constrained. Equities advanced regardless. The S&P 500 gained 2.7% for the month as investors leaned into energy and materials, while the Russell 2000 rose 1.0% for the month and held a 20.0% year to date gain through August 31. The MSCI EAFE Index returned 2.0% for the month, and the MSCI EM Index gained 3.4% for the month on strength in South Korea and Taiwan. The Bloomberg U.S. Aggregate Bond Index returned 0.4% for the month as attractive starting yields cushioned the move in rates. REITs fell 2.7% for the month as long-term rates rose, while the Bloomberg Commodity Index climbed 7.4% for the month as Brent crude moved above $90 per barrel.
September 2026 brought broad weakness across financial markets. The Federal Reserve raised its policy rate by 25 basis points and signaled that additional hikes may be necessary, and the 10-year Treasury yield rose more than 50 basis points to finish the month just below 5.30%, a level not seen since 2007. The S&P 500 declined 0.3% for the month and remained up 12.7% year to date through September 30. The Russell 2000 fell 5.3% for the month as smaller, more leveraged companies felt the impact of higher rates, though it still finished ahead of large caps with a 13.7% year to date gain. The MSCI EAFE Index declined 3.1% for the month, while the MSCI EM Index declined a more modest 0.6% for the month and remains the strongest equity performer for the year. The Bloomberg U.S. Aggregate Bond Index fell 2.6% for the month, and REITs fell 5.7% for the month as tighter financial conditions weighed on listed real estate. Commodities were the only major asset class to advance, with the Bloomberg Commodity Index gaining 0.6% for the month.
NOTABLE DEVELOPMENT: THE “TREASURY TWIST” · AUGUST 2026
On August 19, shortly after the 30-year Treasury yield reached its highest level since 2007, the U.S. Treasury announced it would at least double the maximum size of its long-dated buyback operations, from $2 billion to $4 billion, between September 9 and November 4. Secretary Bessent described the move as a “Treasury Twist.” The 30-year yield fell roughly 10 basis points before reversing the next day, and U.S. debt outstanding crossed $40 trillion the same day, raising the question of whether the Fed or the Treasury will have more influence over long-term rates.
Market Data: Economic Indicators
The figures below supplement the return data on page one and reflect the same July through September 2026 period unless otherwise noted.
What This Means for Portfolios
Higher rates are now the dominant force. Over the quarter the Fed moved from a hold with three dissents in July, to a hawkish message at Jackson Hole in August, to a 25 basis point hike in September, and market pricing suggests at least one more hike at its two remaining meetings this year. Inflation has been above target for 65 consecutive months, and higher energy prices tied to geopolitical instability are adding pressure that tighter financial conditions cannot directly resolve. Rate sensitive areas felt this most, with REITs and small caps each falling more than 5% in September.
Bonds are offering meaningful income. With the Bloomberg U.S. Aggregate Bond Index yielding 5.1% in August against expected inflation of 2.3%, bonds are offering yields above inflation for the first time in many years, and that coupon should help compensate for rate volatility going forward. Duration risk has become more two-sided, with short-term yields anchored by the Fed and long-term yields driven by federal borrowing needs, geopolitics, and Treasury policy. Today’s yields allow investors to earn meaningful income without taking on the full uncertainty of longer-dated bonds.
AI spending still drives earnings, but financing is now in focus. The S&P 500 is expected to post a third consecutive quarter of year over year earnings growth above 25%, which has supported double digit equity returns in 2026 without a matching rise in valuation multiples. At the same time, free cash flow expectations for the major hyperscalers have turned negative due to AI-related spending, pushing more of these companies toward debt financing. With the Fed now raising rates, investors are paying closer attention to leverage and to whether this spending will earn attractive returns.
Taken together, the quarter reinforced the value of diversification across asset classes. Through September 30, small cap and emerging market equities remain ahead of the S&P 500 year to date, international developed equities trail it, and commodities have been the strongest performing major asset class this year, up 32.9%. November’s midterm elections add another source of uncertainty, though markets have historically tended to perform well once midterms conclude. The economy continues to expand, employment conditions remain healthy, and corporate earnings growth continues to exceed expectations in many sectors. We continue to favor a disciplined, broadly diversified approach as we enter the fourth quarter.
As always, we are here and available to discuss.
Disclosures
Comparisons to indices referenced herein are for illustrative purposes only. Indices cannot be invested in directly. Unmanaged index returns assume reinvestment of any and all distributions and do not reflect fees or expenses.
All monthly and year-to-date returns shown are as reported in the July, August, and September 2026 market commentaries from Fiducient Advisors, LLC, a Wealthspire Company. MKD Wealth has not independently verified all information obtained from this source. YTD figures reflect the nine-month period from January 1 through September 30, 2026, as reported directly in the September 2026 commentary. Economic and fundamental data (Federal Reserve policy rate, Treasury yields, inflation, bond yields, earnings growth, and AI-related investment) are as reported in the referenced commentaries, which cite FactSet, CME FedWatch, the U.S. Treasury, the Federal Reserve Bank of Kansas City Jackson Hole symposium, Oxford Economics, and the International Monetary Fund as original sources.
The opinions and market observations presented are as of September 30, 2026, and are subject to change without notice. Any forecasts, expectations or forward-looking statements are based on current assumptions and are not guarantees of future results. This material is provided for general informational purposes and is not individualized investment advice or a recommendation to buy or sell any security or adopt any investment strategy. Appropriate portfolio allocations will vary based on each investor’s objectives, risk tolerance, time horizon, and financial circumstances. All investing involves risk, including the possible loss of principal.
S&P 500: 500 large U.S. companies. Russell 2000: 2,000 smallest companies in the Russell 3000. MSCI EAFE: developed markets ex-U.S./Canada. MSCI EM: emerging market equities. Bloomberg U.S. Aggregate: U.S. investment-grade bonds. Bloomberg Commodity Index: commodity futures. FTSE NAREIT Equity REITs: non-timber/infrastructure equity REITs.
Monthly columns show total returns for July 1 to July 31, August 1 to August 31, and September 1 to September 30, 2026. YTD reflects the nine month period from January 1 through September 30, 2026.
Executive Summary
The third quarter of 2026, covering July 1 through September 30, was shaped by rising interest rates and a Federal Reserve that shifted from holding steady to raising rates. Market leadership broadened in July, equities advanced in August despite a more hawkish message from Fed Chair Kevin Warsh at Jackson Hole, and September brought broad weakness after the Fed raised its policy rate by 25 basis points. Through September 30, the S&P 500 is up 12.7% year to date, the Russell 2000 is up 13.7%, the MSCI EAFE Index is up 10.3%, and the MSCI EM Index is up 23.4%. Bonds struggled as yields rose, with the Bloomberg U.S. Aggregate Bond Index down 2.9% year to date, while commodities gained in all three months of the quarter and are up 32.9% year to date. This report walks through the month by month market backdrop, the underlying economic data for the quarter, and what it means for portfolio positioning heading into the final quarter of the year.
Market Review
July 2026 was a volatile month as investors weighed strong corporate earnings against renewed concerns about AI-related valuations and heavy capital spending. The Federal Reserve held its policy rate at 3.50% to 3.75% at its July 29 meeting, but three dissents in favor of a hike pushed Treasury yields higher. The S&P 500 declined 0.1% for the month, and the Russell 2000 fell 3.0% for the month as rising yields created a headwind for smaller companies. Leadership rotated away from the largest growth stocks toward energy, financials, and more value oriented areas. The MSCI EAFE Index gained 2.0% for the month, helped by strength in Europe and the United Kingdom and a weaker U.S. dollar, while the MSCI EM Index declined 3.1% for the month as semiconductor shares in technology heavy Asian markets pulled back. The Bloomberg U.S. Aggregate Bond Index fell 1.3% for the month. REITs gained 2.4% for the month, supported by data center, industrial, and specialized property sectors, and the Bloomberg Commodity Index rose 7.5% for the month, the best result among major asset classes, as tensions involving Iran contributed to higher energy prices.
August 2026 was constructive but uneven. At the Jackson Hole symposium on August 28, Chair Warsh signaled that rates could move higher, and the odds of a September hike jumped from roughly one in three to better than half. The 10-year Treasury yield climbed above 4.7%, and the 30-year yield touched its highest level since 2007 after the 60-day U.S. and Iran negotiating window lapsed on August 17 with the Strait of Hormuz still constrained. Equities advanced regardless. The S&P 500 gained 2.7% for the month as investors leaned into energy and materials, while the Russell 2000 rose 1.0% for the month and held a 20.0% year to date gain through August 31. The MSCI EAFE Index returned 2.0% for the month, and the MSCI EM Index gained 3.4% for the month on strength in South Korea and Taiwan. The Bloomberg U.S. Aggregate Bond Index returned 0.4% for the month as attractive starting yields cushioned the move in rates. REITs fell 2.7% for the month as long-term rates rose, while the Bloomberg Commodity Index climbed 7.4% for the month as Brent crude moved above $90 per barrel.
September 2026 brought broad weakness across financial markets. The Federal Reserve raised its policy rate by 25 basis points and signaled that additional hikes may be necessary, and the 10-year Treasury yield rose more than 50 basis points to finish the month just below 5.30%, a level not seen since 2007. The S&P 500 declined 0.3% for the month and remained up 12.7% year to date through September 30. The Russell 2000 fell 5.3% for the month as smaller, more leveraged companies felt the impact of higher rates, though it still finished ahead of large caps with a 13.7% year to date gain. The MSCI EAFE Index declined 3.1% for the month, while the MSCI EM Index declined a more modest 0.6% for the month and remains the strongest equity performer for the year. The Bloomberg U.S. Aggregate Bond Index fell 2.6% for the month, and REITs fell 5.7% for the month as tighter financial conditions weighed on listed real estate. Commodities were the only major asset class to advance, with the Bloomberg Commodity Index gaining 0.6% for the month.
NOTABLE DEVELOPMENT: THE “TREASURY TWIST” · AUGUST 2026
On August 19, shortly after the 30-year Treasury yield reached its highest level since 2007, the U.S. Treasury announced it would at least double the maximum size of its long-dated buyback operations, from $2 billion to $4 billion, between September 9 and November 4. Secretary Bessent described the move as a “Treasury Twist.” The 30-year yield fell roughly 10 basis points before reversing the next day, and U.S. debt outstanding crossed $40 trillion the same day, raising the question of whether the Fed or the Treasury will have more influence over long-term rates.
Market Data: Economic Indicators
The figures below supplement the return data on page one and reflect the same July through September 2026 period unless otherwise noted.
What This Means for Portfolios
Higher rates are now the dominant force. Over the quarter the Fed moved from a hold with three dissents in July, to a hawkish message at Jackson Hole in August, to a 25 basis point hike in September, and market pricing suggests at least one more hike at its two remaining meetings this year. Inflation has been above target for 65 consecutive months, and higher energy prices tied to geopolitical instability are adding pressure that tighter financial conditions cannot directly resolve. Rate sensitive areas felt this most, with REITs and small caps each falling more than 5% in September.
Bonds are offering meaningful income. With the Bloomberg U.S. Aggregate Bond Index yielding 5.1% in August against expected inflation of 2.3%, bonds are offering yields above inflation for the first time in many years, and that coupon should help compensate for rate volatility going forward. Duration risk has become more two-sided, with short-term yields anchored by the Fed and long-term yields driven by federal borrowing needs, geopolitics, and Treasury policy. Today’s yields allow investors to earn meaningful income without taking on the full uncertainty of longer-dated bonds.
AI spending still drives earnings, but financing is now in focus. The S&P 500 is expected to post a third consecutive quarter of year over year earnings growth above 25%, which has supported double digit equity returns in 2026 without a matching rise in valuation multiples. At the same time, free cash flow expectations for the major hyperscalers have turned negative due to AI-related spending, pushing more of these companies toward debt financing. With the Fed now raising rates, investors are paying closer attention to leverage and to whether this spending will earn attractive returns.
Taken together, the quarter reinforced the value of diversification across asset classes. Through September 30, small cap and emerging market equities remain ahead of the S&P 500 year to date, international developed equities trail it, and commodities have been the strongest performing major asset class this year, up 32.9%. November’s midterm elections add another source of uncertainty, though markets have historically tended to perform well once midterms conclude. The economy continues to expand, employment conditions remain healthy, and corporate earnings growth continues to exceed expectations in many sectors. We continue to favor a disciplined, broadly diversified approach as we enter the fourth quarter.
As always, we are here and available to discuss.
Disclosures
Comparisons to indices referenced herein are for illustrative purposes only. Indices cannot be invested in directly. Unmanaged index returns assume reinvestment of any and all distributions and do not reflect fees or expenses.
All monthly and year-to-date returns shown are as reported in the July, August, and September 2026 market commentaries from Fiducient Advisors, LLC, a Wealthspire Company. MKD Wealth has not independently verified all information obtained from this source. YTD figures reflect the nine-month period from January 1 through September 30, 2026, as reported directly in the September 2026 commentary. Economic and fundamental data (Federal Reserve policy rate, Treasury yields, inflation, bond yields, earnings growth, and AI-related investment) are as reported in the referenced commentaries, which cite FactSet, CME FedWatch, the U.S. Treasury, the Federal Reserve Bank of Kansas City Jackson Hole symposium, Oxford Economics, and the International Monetary Fund as original sources.
The opinions and market observations presented are as of September 30, 2026, and are subject to change without notice. Any forecasts, expectations or forward-looking statements are based on current assumptions and are not guarantees of future results. This material is provided for general informational purposes and is not individualized investment advice or a recommendation to buy or sell any security or adopt any investment strategy. Appropriate portfolio allocations will vary based on each investor’s objectives, risk tolerance, time horizon, and financial circumstances. All investing involves risk, including the possible loss of principal.
S&P 500: 500 large U.S. companies. Russell 2000: 2,000 smallest companies in the Russell 3000. MSCI EAFE: developed markets ex-U.S./Canada. MSCI EM: emerging market equities. Bloomberg U.S. Aggregate: U.S. investment-grade bonds. Bloomberg Commodity Index: commodity futures. FTSE NAREIT Equity REITs: non-timber/infrastructure equity REITs.