


Website & Messaging Privacy Policy | Designation Disclosures | Accessibility Statement
This website is for informational purposes only and does not constitute a complete description of our investment services or performance. This website is in no way a solicitation or offer to sell securities or investment advisory services except, where applicable, in states where we are registered or where an exemption or exclusion from such registration exists. Nothing on this website should be interpreted to state or imply that past results are an indication of future performance.
©2026 MKD Wealth Coaches, LLC. |All Rights Reserved|Website Developed by ARS Digital Marketing
©2026 MKD Wealth Coaches, LLC.
All Rights Reserved
Website Developed by ARS Digital Marketing

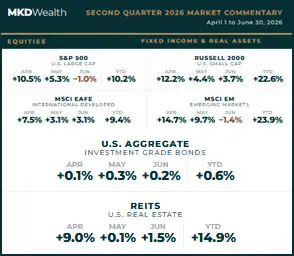
Monthly columns show total returns for April 1 to April 30, May 1 to May 31, and June 1 to June 30, 2026. YTD reflects the six month period from January 1 through June 30, 2026.
Executive Summary
The second quarter of 2026, covering April 1 through June 30, delivered a strong recovery across most major asset classes following a difficult start to the year. Corporate earnings were the primary catalyst. The strongest earnings season in nearly five years fueled a sharp rally in April, improving diplomatic signals between the United States and Iran extended the advance into May, and June brought a healthier rotation as leadership broadened beyond the largest U.S. companies. Through June 30, the S&P 500 is up 10.2% year to date, the Russell 2000 is up 22.6%, and the MSCI EM Index is up 23.9%, while investment grade bonds and REITs also remain positive for the year. Commodities are also up double digits year to date, though the asset class declined in both May and June as energy prices retraced the risk premium built up earlier in the year. This report walks through the month by month market backdrop, the underlying economic data for the quarter, and what it means for portfolio positioning heading into the second half of the year.
Market Review
April 2026 delivered a sharp recovery across global markets as first quarter earnings season restored investor confidence following a difficult start to the year. For the month, the S&P 500 returned 10.5%, led by communication services, information technology, and consumer discretionary, with earnings surprises from Alphabet, Amazon, and Meta driving much of the gain. The Russell 2000 returned 12.2% for the month as easing recession concerns and broader earnings strength across cyclical sectors supported small caps. International equities also advanced: the MSCI EAFE Index returned 7.5% for the month, helped by a weaker U.S. dollar that added more than 200 basis points to returns for U.S. investors, and the MSCI EM Index returned 14.7% for the month as semiconductor and AI infrastructure demand accelerated. Fixed income was more muted, with the Bloomberg U.S. Aggregate Bond Index returning 0.1% for the month as the Federal Reserve held its policy rate at 3.50% to 3.75% at its April meeting, Chair Powell’s final meeting in that role. REITs returned 9.0% for the month, with broad participation across property types.
May 2026 extended the rally as markets grew optimistic about a potential diplomatic breakthrough between the United States and Iran, and strong technology earnings pushed major indices to fresh highs. The S&P 500 returned 5.3% for the month, closing above 7,500 for the first time, with Nvidia reporting 85% year over year revenue growth. The Russell 2000 returned 4.4% for the month and reached a new all time high. The MSCI EAFE Index returned 3.1% for the month, and the MSCI EM Index returned 9.7% for the month on continued semiconductor strength in Taiwan and South Korea. The U.S. and Iran agreed to a 60-day memorandum of understanding to reopen the Strait of Hormuz, and oil prices fell nearly 17% for the month, their largest monthly decline since April 2025. Kevin Warsh was sworn in as Fed Chair during May against a difficult backdrop: April 2026 PCE inflation, the Fed’s preferred gauge, came in at 3.8% year over year, its highest level since mid-2023, and first quarter GDP growth was revised down to 1.6% from an initial 2.0% estimate. The Bloomberg U.S. Aggregate Bond Index returned 0.3% for the month, and REITs returned 0.1% for the month.
June 2026 brought a more uneven tone and a clear shift in market leadership. The S&P 500 declined 1.0% for the month, though it remained up 10.2% year to date through June 30. The Russell 2000 gained 3.7% for the month, a rare month of small cap outperformance that extended its year to date return to 22.6%. The MSCI EAFE Index returned 3.1% for the month and is up 9.4% year to date, while the MSCI EM Index declined 1.4% for the month even as it remains up 23.9% year to date. The Federal Reserve held its policy rate steady at its June meeting, with Chair Warsh emphasizing price stability. May 2026 PCE inflation rose to 4.1% year over year, and first quarter GDP growth was revised higher to 2.1%. The Bloomberg U.S. Aggregate Bond Index returned 0.2% for the month, and REITs returned 1.5% for the month, helped by a late month decline in yields. Commodities fell sharply for the month as energy prices continued to reprice lower, though the asset class remains up 14.4% year to date.
NOTABLE DEVELOPMENT: THE SPACEX IPO · JUNE 2026
SpaceX completed its initial public offering in June, raising approximately $75 billion in the largest IPO in history. Shares rose nearly 20% on the first day of trading, and the company’s market value surpassed $2 trillion, making it the sixth largest U.S. company by market value at quarter end. The offering is expected to be the first in a wave of large private companies, including OpenAI, Anthropic, and Databricks, that may come to public markets over the next year.
Market Data: Economic Indicators
The figures below supplement the return data on page one and reflect the same April through June 2026 period unless otherwise noted.
What This Means for Portfolios
Corporate earnings remain the foundation. First quarter 2026 earnings growth for the S&P 500 came in at 27.7% year over year, the strongest pace since the fourth quarter of 2021. Growth remains concentrated, with the largest technology companies growing earnings 61% year over year versus 16% for the rest of the index, but participation is broadening: seven of eleven sectors posted double digit earnings growth for the quarter, and companies reported the lowest frequency of earnings misses in 25 years, excluding the pandemic period. Elevated valuations, with the S&P 500 trading at a forward price to earnings ratio of 21x versus a 10 year average of 18.9x, depend on this earnings strength continuing through the rest of the year.
A new Fed Chair is navigating a difficult mix. Kevin Warsh inherited a Federal Reserve balancing inflation that has moved further above target, with long-term consensus expectations near 3.5%, against a labor market that has held up but is not especially strong. The Fed held rates steady at both its April and June meetings this quarter, and April’s minutes showed the most internal dissent since 1992. That combination leaves less room to cut rates even as growth data has been mixed.
The reopened IPO market is changing the supply picture. SpaceX’s record setting IPO in June, together with an expected wave of large private companies coming to market over the next year, could shift U.S. equities away from a decade in which buybacks outpaced new share issuance and toward a more neutral supply and demand balance. That is not necessarily a negative signal for equities, but it does place more weight on continued earnings growth to support prices.
Taken together, the quarter reinforced the value of staying diversified. Small cap and emerging market equities each outpaced the S&P 500 for the quarter and year to date through June 30, while international developed equities also posted solid gains, running just behind the S&P 500 on both measures. Fixed income and REITs added ballast even as commodities gave back some of their early year gains. Bond yields remain well above 4%, which continues to provide meaningful income and a cushion against rate volatility. We continue to favor a disciplined, broadly diversified approach as markets navigate a still uncertain mix of monetary policy, corporate earnings, and equity supply heading into the second half of the year.
As always, we are here and available to discuss.
Disclosures
Comparisons to indices referenced herein are for illustrative purposes only. Indices cannot be invested in directly. Unmanaged index returns assume reinvestment of any and all distributions and do not reflect fees or expenses.
All monthly and year-to-date returns shown are as reported in the April, May, and June 2026 market commentaries from a third party. YTD figures reflect the six-month period from January 1 through June 30, 2026, as reported directly in the June 2026 commentary. Economic and fundamental data (Federal Reserve policy rate, PCE inflation, GDP growth, earnings growth, valuation, and inflation expectations) are as reported in the referenced commentaries, which cite FactSet Earnings Insight, Goldman Sachs Global Investment Research, and Bloomberg Finance LP as original sources. MKD Wealth has not independently verified all information obtained from third-party sources.
The opinions and market observations presented are as of June 30, 2026, and are subject to change without notice. Any forecasts, expectations or forward-looking statements are based on current assumptions and are not guarantees of future results. This material is provided for general informational purposes and is not individualized investment advice or a recommendation to buy or sell any security or adopt any investment strategy. Appropriate portfolio allocations will vary based on each investor’s objectives, risk tolerance, time horizon, and financial circumstances. All investing involves risk, including the possible loss of principal.
S&P 500: 500 large U.S. companies. Russell 2000: 2,000 smallest companies in the Russell 3000. MSCI EAFE: developed markets ex-U.S./Canada. MSCI EM: emerging market equities. Bloomberg U.S. Aggregate: U.S. investment-grade bonds. Bloomberg Commodity Index: commodity futures. FTSE NAREIT Equity REITs: non-timber/infrastructure equity REITs.
Monthly columns show total returns for April 1 to April 30, May 1 to May 31, and June 1 to June 30, 2026. YTD reflects the six month period from January 1 through June 30, 2026.
Executive Summary
The second quarter of 2026, covering April 1 through June 30, delivered a strong recovery across most major asset classes following a difficult start to the year. Corporate earnings were the primary catalyst. The strongest earnings season in nearly five years fueled a sharp rally in April, improving diplomatic signals between the United States and Iran extended the advance into May, and June brought a healthier rotation as leadership broadened beyond the largest U.S. companies. Through June 30, the S&P 500 is up 10.2% year to date, the Russell 2000 is up 22.6%, and the MSCI EM Index is up 23.9%, while investment grade bonds and REITs also remain positive for the year. Commodities are also up double digits year to date, though the asset class declined in both May and June as energy prices retraced the risk premium built up earlier in the year. This report walks through the month by month market backdrop, the underlying economic data for the quarter, and what it means for portfolio positioning heading into the second half of the year.
Market Review
April 2026 delivered a sharp recovery across global markets as first quarter earnings season restored investor confidence following a difficult start to the year. For the month, the S&P 500 returned 10.5%, led by communication services, information technology, and consumer discretionary, with earnings surprises from Alphabet, Amazon, and Meta driving much of the gain. The Russell 2000 returned 12.2% for the month as easing recession concerns and broader earnings strength across cyclical sectors supported small caps. International equities also advanced: the MSCI EAFE Index returned 7.5% for the month, helped by a weaker U.S. dollar that added more than 200 basis points to returns for U.S. investors, and the MSCI EM Index returned 14.7% for the month as semiconductor and AI infrastructure demand accelerated. Fixed income was more muted, with the Bloomberg U.S. Aggregate Bond Index returning 0.1% for the month as the Federal Reserve held its policy rate at 3.50% to 3.75% at its April meeting, Chair Powell’s final meeting in that role. REITs returned 9.0% for the month, with broad participation across property types.
May 2026 extended the rally as markets grew optimistic about a potential diplomatic breakthrough between the United States and Iran, and strong technology earnings pushed major indices to fresh highs. The S&P 500 returned 5.3% for the month, closing above 7,500 for the first time, with Nvidia reporting 85% year over year revenue growth. The Russell 2000 returned 4.4% for the month and reached a new all time high. The MSCI EAFE Index returned 3.1% for the month, and the MSCI EM Index returned 9.7% for the month on continued semiconductor strength in Taiwan and South Korea. The U.S. and Iran agreed to a 60-day memorandum of understanding to reopen the Strait of Hormuz, and oil prices fell nearly 17% for the month, their largest monthly decline since April 2025. Kevin Warsh was sworn in as Fed Chair during May against a difficult backdrop: April 2026 PCE inflation, the Fed’s preferred gauge, came in at 3.8% year over year, its highest level since mid-2023, and first quarter GDP growth was revised down to 1.6% from an initial 2.0% estimate. The Bloomberg U.S. Aggregate Bond Index returned 0.3% for the month, and REITs returned 0.1% for the month.
June 2026 brought a more uneven tone and a clear shift in market leadership. The S&P 500 declined 1.0% for the month, though it remained up 10.2% year to date through June 30. The Russell 2000 gained 3.7% for the month, a rare month of small cap outperformance that extended its year to date return to 22.6%. The MSCI EAFE Index returned 3.1% for the month and is up 9.4% year to date, while the MSCI EM Index declined 1.4% for the month even as it remains up 23.9% year to date. The Federal Reserve held its policy rate steady at its June meeting, with Chair Warsh emphasizing price stability. May 2026 PCE inflation rose to 4.1% year over year, and first quarter GDP growth was revised higher to 2.1%. The Bloomberg U.S. Aggregate Bond Index returned 0.2% for the month, and REITs returned 1.5% for the month, helped by a late month decline in yields. Commodities fell sharply for the month as energy prices continued to reprice lower, though the asset class remains up 14.4% year to date.
NOTABLE DEVELOPMENT: THE SPACEX IPO · JUNE 2026
SpaceX completed its initial public offering in June, raising approximately $75 billion in the largest IPO in history. Shares rose nearly 20% on the first day of trading, and the company’s market value surpassed $2 trillion, making it the sixth largest U.S. company by market value at quarter end. The offering is expected to be the first in a wave of large private companies, including OpenAI, Anthropic, and Databricks, that may come to public markets over the next year.
Market Data: Economic Indicators
The figures below supplement the return data on page one and reflect the same April through June 2026 period unless otherwise noted.
What This Means for Portfolios
Corporate earnings remain the foundation. First quarter 2026 earnings growth for the S&P 500 came in at 27.7% year over year, the strongest pace since the fourth quarter of 2021. Growth remains concentrated, with the largest technology companies growing earnings 61% year over year versus 16% for the rest of the index, but participation is broadening: seven of eleven sectors posted double digit earnings growth for the quarter, and companies reported the lowest frequency of earnings misses in 25 years, excluding the pandemic period. Elevated valuations, with the S&P 500 trading at a forward price to earnings ratio of 21x versus a 10 year average of 18.9x, depend on this earnings strength continuing through the rest of the year.
A new Fed Chair is navigating a difficult mix. Kevin Warsh inherited a Federal Reserve balancing inflation that has moved further above target, with long-term consensus expectations near 3.5%, against a labor market that has held up but is not especially strong. The Fed held rates steady at both its April and June meetings this quarter, and April’s minutes showed the most internal dissent since 1992. That combination leaves less room to cut rates even as growth data has been mixed.
The reopened IPO market is changing the supply picture. SpaceX’s record setting IPO in June, together with an expected wave of large private companies coming to market over the next year, could shift U.S. equities away from a decade in which buybacks outpaced new share issuance and toward a more neutral supply and demand balance. That is not necessarily a negative signal for equities, but it does place more weight on continued earnings growth to support prices.
Taken together, the quarter reinforced the value of staying diversified. Small cap and emerging market equities each outpaced the S&P 500 for the quarter and year to date through June 30, while international developed equities also posted solid gains, running just behind the S&P 500 on both measures. Fixed income and REITs added ballast even as commodities gave back some of their early year gains. Bond yields remain well above 4%, which continues to provide meaningful income and a cushion against rate volatility. We continue to favor a disciplined, broadly diversified approach as markets navigate a still uncertain mix of monetary policy, corporate earnings, and equity supply heading into the second half of the year.
As always, we are here and available to discuss.
Disclosures
Comparisons to indices referenced herein are for illustrative purposes only. Indices cannot be invested in directly. Unmanaged index returns assume reinvestment of any and all distributions and do not reflect fees or expenses.
All monthly and year-to-date returns shown are as reported in the April, May, and June 2026 market commentaries from a third party. YTD figures reflect the six-month period from January 1 through June 30, 2026, as reported directly in the June 2026 commentary. Economic and fundamental data (Federal Reserve policy rate, PCE inflation, GDP growth, earnings growth, valuation, and inflation expectations) are as reported in the referenced commentaries, which cite FactSet Earnings Insight, Goldman Sachs Global Investment Research, and Bloomberg Finance LP as original sources. MKD Wealth has not independently verified all information obtained from third-party sources.
The opinions and market observations presented are as of June 30, 2026, and are subject to change without notice. Any forecasts, expectations or forward-looking statements are based on current assumptions and are not guarantees of future results. This material is provided for general informational purposes and is not individualized investment advice or a recommendation to buy or sell any security or adopt any investment strategy. Appropriate portfolio allocations will vary based on each investor’s objectives, risk tolerance, time horizon, and financial circumstances. All investing involves risk, including the possible loss of principal.
S&P 500: 500 large U.S. companies. Russell 2000: 2,000 smallest companies in the Russell 3000. MSCI EAFE: developed markets ex-U.S./Canada. MSCI EM: emerging market equities. Bloomberg U.S. Aggregate: U.S. investment-grade bonds. Bloomberg Commodity Index: commodity futures. FTSE NAREIT Equity REITs: non-timber/infrastructure equity REITs.